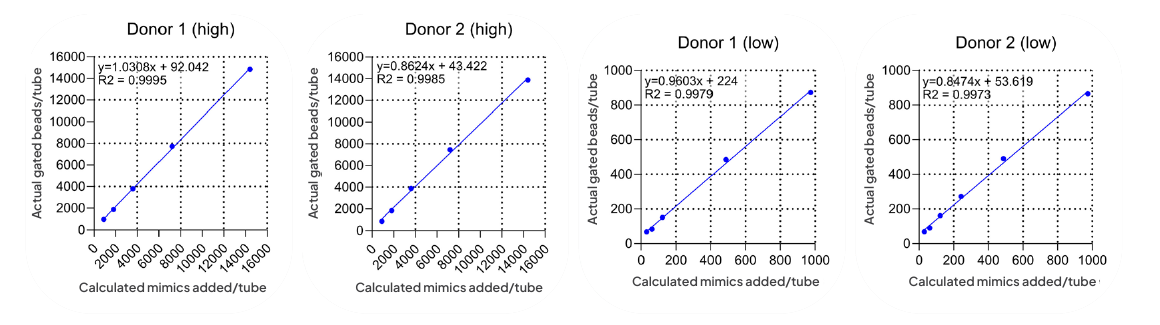
- >0.99R2 values throughout the test range
- 0.2%of total gated CD45+ events, the lower bound of robust linearity
- 0.05%lower limit of quantification, CD34+ of total CD45+ events
- ~150spiked cell mimics per test sample at the lowest linear point
Introduction
The most important prerequisite to performing this is a standard material of known analyte quantity. This would be spiked in at various levels into the tested matrix and the readout compared. For flow cytometry based tests, this is traditionally not possible because standard cells expressing the epitope of interest at a fixed level do not exist.
Slingshot Biosciences has a range of hydrogels having lymphocyte scatter properties and the ability to be coated with certain antigens. Recently, we have obtained a vial of Slingshot Biosciences Cell Mimic™ bearing CD45 and CD34. We utilized a version containing 90% of the cell mimics in the vial are coated with both CD45 and CD34, with a total of ~250,000 cell mimics per vial (i.e. ~225,000 CD34+ cell mimics per vial). While not a complete validation, herein we experimented to see if these cell mimics could assist in the estimation of sensitivity on a flow based clinical test.
Methods
The lyophilized vial kept at -20°C was spun down to pellet all cell mimics before reconstituting with 500 µL of PBS with 1% BSA. The cell mimics were mixed by pipetting and then directly pipetted from the vial into whole blood or diluted with PBS with 1% BSA before adding to whole blood at different volumes.
Whole blood was obtained from two healthy adult donors on the same day as testing. All assays were performed within 8 hours of cell mimic reconstitution to avoid degradation.
Blood and cell mimic mixtures were lysed with ammonium chloride after being stained with anti-CD45 (FITC) and anti-CD34 (PE) antibodies. Washed samples were then incubated with 7-AAD for 10 minutes before being further diluted using PBS with 4% FBS, and acquired on a BD Bioscience FACS Lyric. Resulting data was analyzed on FCS Express v6.
Results
We first examined the system linearity by spiking in decreasing volumes of cell mimics into a similar volume of whole blood. This was performed in two sets of ‘high’ and ‘low’ cell mimic numbers. The data below compares the theoretical number of cell mimics that should be collected against the actual number of cell mimics gated. Values normalized for volume acquired on the cytometer and naturally occurring CD34+ cells from the donor themselves which was estimated from a tube ran without any spiked in cell mimics. The protocol includes multiple wash and spin steps and so we expect some loss in the experimental cell mimic counts.
Highly linear values were found throughout the test range, down to approximately 150 spiked in cell mimics per test sample (0.2% of lymphocytes) with R2 values exceeding 0.99. Tubes with <100 cell mimics spiked showed persistently higher experimental values compared to theoretical values, suggesting background noise overcoming the signal or possibly from variability in the number of naturally occurring CD34+ cells. If repeated on a sample with depleted CD34 cells, we predict that these values could be more accurate.
| Set | Tube | Theoretical Cell Mimic# | Actual Cell Mimic # Acquired: Donor 1 | Actual Cell Mimic # Acquired: Donor 2 | % Cell Mimics of Total CD45+: Donor 1 | % Cell Mimics of Total CD45+: Donor 2 |
|---|---|---|---|---|---|---|
| High Set | A | 18000 | 14846 | 13870 | 9.03 | 14.37 |
| High Set | B | 9000 | 7722 | 7464 | 4.86 | 7.77 |
| High Set | C | 4500 | 3789 | 3874 | 2.45 | 4.19 |
| High Set | D | 2250 | 1870 | 1834 | 1.27 | 2.27 |
| High Set | E | 1125 | 992 | 871 | 0.68 | 1.13 |
| Low Set | F | 1218 | 873 | 865 | 0.73 | 1.03 |
| Low Set | G | 609 | 485 | 490 | 0.37 | 0.62 |
| Low Set | H | 305 | n.d. | 272 | n.d. | 0.35 |
| Low Set | I | 152 | 151 | 161 | 0.12 | 0.20 |
| Low Set | J | 76 | 84 | 90 | 0.08 | 0.12 |
| Low Set | K | 38 | 68 | 69 | 0.07 | 0.09 |
Table 1: Layout of blood spiked with varying number of cell mimics. Experiment done in two parts for high and low cell mimic counts. The number of theoretical cell mimics spiked and actual number gated displayed showing as expected slightly lower values experimentally. The percentage cell mimics of total CD45+ events also displayed. n.d. no data, where a technical error forced that datapoint to be removed.
Tubes F-K were repeated a total of three times and the percentage of CD34+ cell mimics of total CD45+ events extracted. The %CV from the three repeats are calculated and presented in the table below. These values have been corrected for volume analyzed on the cytometer and the natural CD34+ cells found per donor. Traditionally, a limit of CV <30% is taken for determining the limits of quantification. From the table below, while Donor 2 shows a small %CV down to the last dilution, Donor 1 has a CV>30% after additions of <50 cell mimics per sample (in red). For both these samples, the lower limit of quantification (LLOQ) can be deduced to be close to 0.05% (in green). These results indicate that only levels ≥0.05% CD34+ of total CD45+ events are reportable for this assay. Percentages found lower than 0.05% cannot be reported confidently due to possibly large %CVs.
| Tube | %CD34+ of CD45+: Donor 1 | %CD34+ of CD45+: Donor 2 | Ave. %34+ of CD45+: Donor 1 | Ave. %34+ of CD45+: Donor 2 | %CV: Donor 1 | %CV: Donor 2 |
|---|---|---|---|---|---|---|
| F1 | 0.708 | 1.055 | 0.71 | 0.99 | 2.70 | 10.70 |
| F2 | 0.724 | 0.865 | ||||
| F3 | 0.686 | 1.039 | ||||
| G1 | 0.346 | 0.567 | 0.34 | 0.57 | 4.20 | 0.86 |
| G2 | 0.325 | 0.573 | ||||
| G3 | 0.353 | 0.577 | ||||
| H1 | n.d. | 0.316 | n.d. | 0.30 | n.d. | 10.64 |
| H2 | n.d. | 0.327 | ||||
| H3 | n.d. | 0.266 | ||||
| I1 | 0.084 | 0.164 | 0.09 | 0.15 | 6.85 | 9.18 |
| I2 | 0.093 | 0.162 | ||||
| I3 | 0.095 | 0.138 | ||||
| J1 | 0.051 | 0.069 | 0.05 | 0.07 | 13.05 | 11.02 |
| J2 | 0.041 | 0.074 | ||||
| J3 | 0.052 | 0.059 | ||||
| K1 | 0.023 | 0.046 | 0.03 | 0.04 | 65.72 | 13.90 |
| K2 | 0.058 | 0.035 | ||||
| K3 | 0.018 | 0.040 |
Table 2: Estimating the LLOQ of the assay based on the CV>30% cutoff rule. In green are the limits where CV<30% are noted with both hovering around 0.05%.
Conclusion
In this short report, we have evaluated the use of Slingshot Biosciences CD34+ Stem Cell Mimic™ as a possible tool for estimating limits for flow cytometry based tests. Based on the experimental results, we can expect robust linearity of results down to 0.2% of total gated CD45+ events with a lower limit of quantification set at 0.05% CD34+ of total CD45+ events.
Acknowledgments
CD34+ Stem Cell Mimic™ particles were a kind gift from Slingshot Biosciences.
The Diagnostic Immunology Laboratory (DIL) is a CLIA certified and CAP accredited clinical laboratory at Cincinnati Children’s Hospital Medical Center. Our comprehensive test menu has been developed to assist in the diagnosis and management of rare inborn errors of immunity (IEI), pediatric oncology, platelet and red blood cell disorders.
Featured product
CD34+ Stem Cell Mimic™
slingshotbio.com/products/cd34-stem-cell-mimicSSB-38-A
 View all product info
For Research Use Only. Not for use in diagnostic or therapeutic procedures.
Stay Updated
Subscribe to receive product updates, new resources, webinars, and application notes.
Get the full application note
Download the complete note as a PDF, with the figures and reference, to share with your team.
Download PDF