- <5%post-calibration %CV across instruments for all nine populations, FSC and SSC (Table 2)
- −2.2% to +4.5%FSC variation between pre- and post-PMI (SSC: −1.5% to +3.6%)
- 1 monthpost-calibration monitoring across three cytometers, through routine preventive maintenance
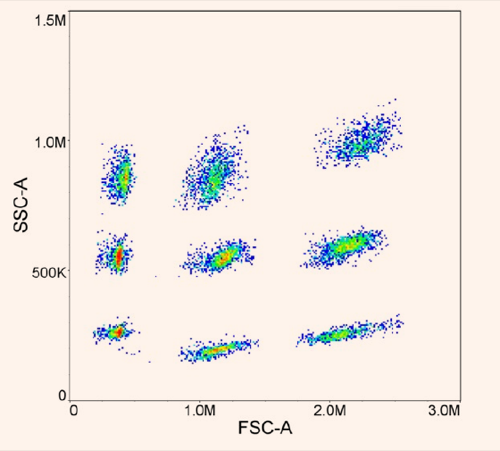
- 3×3 gridnine ScatterBridge populations resolved on FSC vs SSC plots
Introduction
Despite their importance, FSC and SSC profiles lack widely adopted standardized controls for instrument harmonization, resulting in variability across instruments, operators, and sites.
This variability presents a major challenge for assay consistency and regulatory compliance—particularly in multi-site studies, manufacturing workflows, and other regulated environments where consistent, reproducible data are critical.
Traditional controls, including fluorescence calibration beads, can monitor detector sensitivity but do not correct for variability in forward and side scatter detection of experimental samples. Biological controls, including healthy donor peripheral blood mononuclear cells (PBMCs), can more closely standardize scatter detection but present new challenges related to biohazard risk, instability, and lot-to-lot variability.
ScatterBridge™, developed by Slingshot Biosciences, is a non-biohazardous, hydrogel-based reference control designed to standardize FSC and SSC. It provides a stable and reproducible solution for aligning scatter signals across instruments, operators and over time. ScatterBridge™ contains nine distinct populations that resolve into a 3×3 grid on FSC vs SSC plots, spanning a broad dynamic range to support instrument lifecycle management, cross-platform comparability, and longitudinal tracking for regulatory environments.
Methods
Reagent Preparation
- ScatterBridge™ was stored at 2–8°C and equilibrated to room temperature prior to use.
- ScatterBridge was vortexed on high for 2 seconds to mix thoroughly.
- One drop of ScatterBridge was added to 250uL of Stain Buffer in a 5mL FACS tube.
- The sample was vortexed for 5–10 seconds to ensure uniform suspension.
Data Acquisition
- Samples were acquired on a flow cytometer at low to medium flow rate.
- A minimum of 10,000 events were collected per run.
- FSC and SSC gains or voltages were adjusted to resolve all nine populations simultaneously.
Experimental Design
Scatter Standardization Across Instruments and Acquisition Dates
The application of ScatterBridge controls for comprehensive scatter calibration was evaluated across multiple use cases and instruments, including two 5-laser cytometers (“A” and “B”) and one 3-laser cytometer (“C”). For each experimental condition, a single baseline cytometer (5-laser instrument “A”) was designated, enabling quantification of variability between instruments and over time.
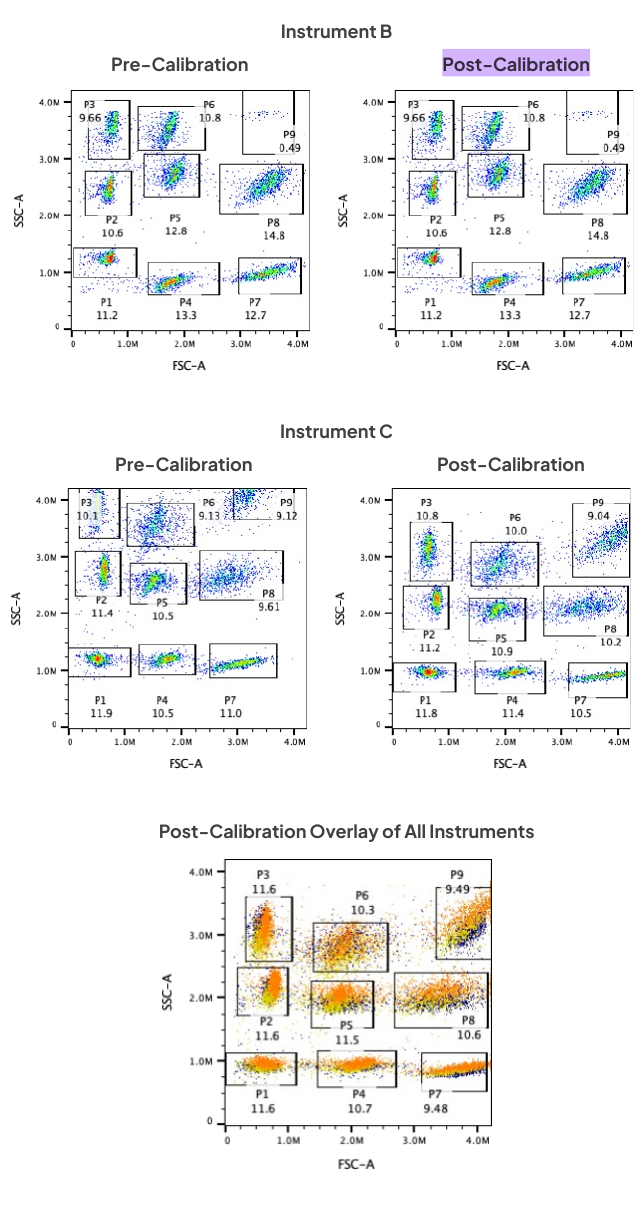
- Instrument Harmonization: Initial instrument variability was assessed by recording ScatterBridge controls prior to adjusting gain settings on the two experimental instruments to match the FSC and SSC median scatter intensity (MSI) of each ScatterBridge population on the baseline cytometer. After this calibration, the ScatterBridge control was re-acquired to evaluate post-calibration consistency across all instruments.
- Biological Sample–Guided Scatter Calibration: Representative biological samples (PBMCs or cultured cells) were used to initially adjust scatter voltages across multiple instruments by matching the MSI of target cell populations. ScatterBridge was then used as an independent reference control to monitor instrument stability for up to one month post-calibration. During this time, the instruments underwent regularly scheduled preventative maintenance (PM).
Instrument Lifecycle Management
To support comprehensive instrument lifecycle management, ScatterBridge was utilized during critical transition events. This included
- Lab Move Evaluation: ScatterBridge controls were acquired before and after instrument relocation to ensure optical alignment was maintained during transit.
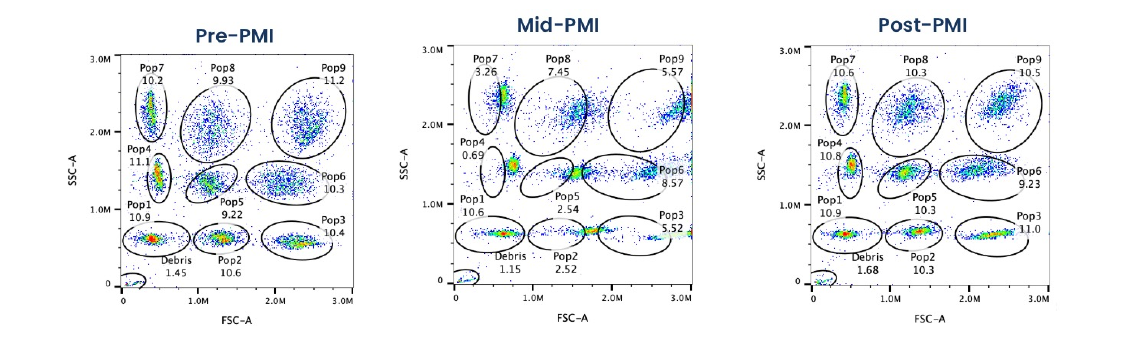
- Preventative Maintenance Intervention (PMI): ScatterBridge was acquired pre-, mid- and post-maintenance to quantify shifts and validate recalibration.
Data Analysis
- FSC vs SSC plots were evaluated for:
- Population resolution
- Positional alignment
- MSI values, percent changes from baseline (baseline instrument or pre-maintenance timepoint) and the coefficient of variation (CV) across conditions were calculated.
Results and Discussion
Scatter Standardization Across Instruments
Instrument Harmonization
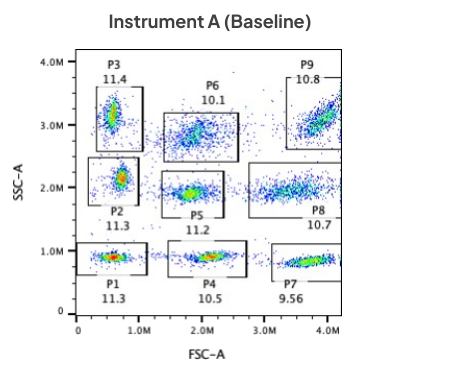
Prior to gain adjustment, population positions varied noticeably across the cytometers - indicating differences in detector sensitivity and signal scaling. Following adjustment of FSC and SSC voltages using ScatterBridge, population distributions across all instruments were aligned to the reference cytometer, resulting in close agreement with the defined standard.
This harmonization resulted in:
- Consistent scatter measurements across instruments
- Reduced inter-instrument variability
- Improved comparability across operators and sites
Such standardization is particularly critical for laboratories undergoing regulatory or quality audits, as it provides quantitative evidence of instrument equivalence beyond what fluorescence calibration beads can demonstrate alone.
| Populations | Instrument A (Baseline) FSC MSI | Instrument A (Baseline) SSC MSI | Instrument B FSC MSI | Instrument B SSC MSI | Instrument C FSC MSI | Instrument C SSC MSI | %CV Across Instruments FSC MSI | %CV Across Instruments SSC MSI |
|---|---|---|---|---|---|---|---|---|
| P1 | 593525 | 899691 | 674709 | 1246277 | 526177 | 1203885 | 12.43 | 16.93 |
| P2 | 726811 | 2140031 | 675692 | 2476247 | 640531 | 2764097 | 6.37 | 12.70 |
| P3 | 586759 | 3130802 | 737128 | 3595589 | 521738 | 3866508 | 17.96 | 10.54 |
| P4 | 2124086 | 909053 | 1753798 | 830796 | 1731719 | 1199885 | 11.79 | 19.85 |
| P5 | 1815607 | 1905725 | 1816051 | 2730343 | 1496001 | 2560696 | 10.80 | 18.15 |
| P6 | 1875313 | 2815478 | 1716851 | 3525309 | 1544034 | 3550350 | 9.68 | 12.65 |
| P7 | 3705922 | 841139 | 3431922 | 986049 | 3038964 | 1123125 | 9.88 | 14.34 |
| P8 | 3393114 | 1949552 | 3449166 | 2545480 | 2767816 | 2613133 | 11.81 | 15.41 |
| P9 | 3858300 | 3049027 | 3602442 | 4194304 | 3058340 | 3991682 | 11.65 | 16.32 |
Table 1: Pre-calibration median scatter intensity (MSI) of ScatterBridge populations in forward scatter (FSC) and side scatter (SSC) across three instruments.
| Populations | Instrument A (Baseline) FSC MSI | Instrument A (Baseline) SSC MSI | Instrument B FSC MSI | Instrument B SSC MSI | Instrument C FSC MSI | Instrument C SSC MSI | %CV Across Instruments FSC MSI | %CV Across Instruments SSC MSI |
|---|---|---|---|---|---|---|---|---|
| P1 | 593525 | 899691 | 614668 | 911067 | 645304 | 977372 | 4.21 | 4.51 |
| P2 | 726811 | 2140031 | 744817 | 2099884 | 783953 | 2241535 | 3.89 | 3.38 |
| P3 | 586759 | 3130802 | 600528 | 2967565 | 643502 | 3135826 | 4.85 | 3.11 |
| P4 | 2124086 | 909053 | 2052788 | 915660 | 2120969 | 969533 | 1.92 | 3.56 |
| P5 | 1815607 | 1905725 | 1782869 | 1944686 | 1814367 | 2070179 | 1.03 | 4.35 |
| P6 | 1875313 | 2815478 | 1853295 | 2706121 | 1889987 | 2858537 | 0.99 | 2.81 |
| P7 | 3705922 | 841139 | 3597398 | 844334 | 3766765 | 907240 | 2.33 | 4.31 |
| P8 | 3393114 | 1949552 | 3282601 | 1961615 | 3423748 | 2117134 | 2.21 | 4.65 |
| P9 | 3858300 | 3049027 | 3778224 | 3053785 | 3841974 | 3304741 | 1.11 | 4.66 |
Table 2: Post-calibration median scatter intensity (MSI) of ScatterBridge populations in forward scatter (FSC) and side scatter (SSC) across three instruments.
Pre- vs Post-Adjustment Comparison
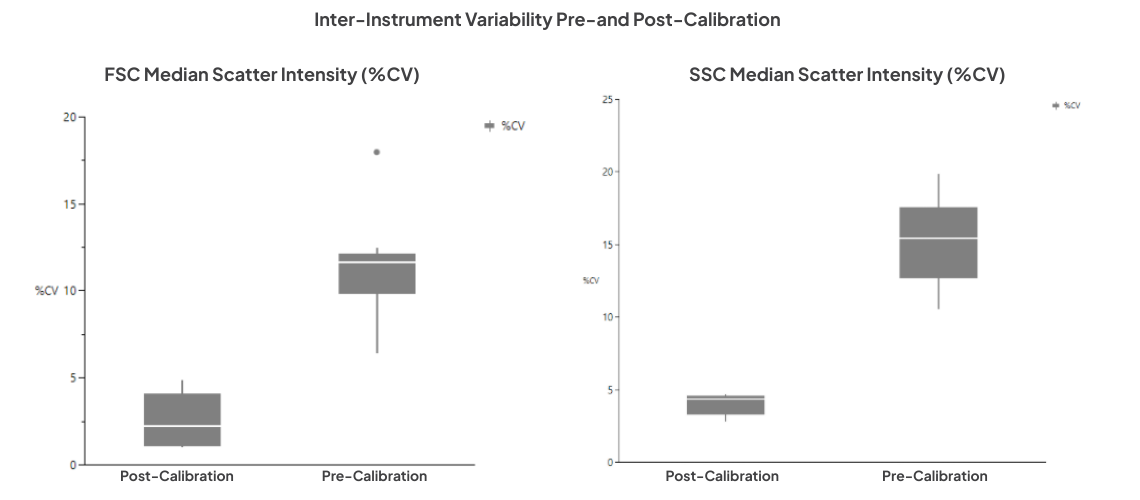
Comparison of Table 1 and Table 2 highlight a marked reduction in inter-instrument variability after utilizing ScatterBridge controls for scatter detector calibration. The decrease in %CV values across all nine populations confirms successful harmonization of scatter signals, with populations consistently aligned to the reference instrument. This improvement demonstrates the effectiveness of ScatterBridge in standardizing instrument performance and ensuring reproducible, comparable data across multiple platforms.
Biological Sample–Guided Scatter Calibration
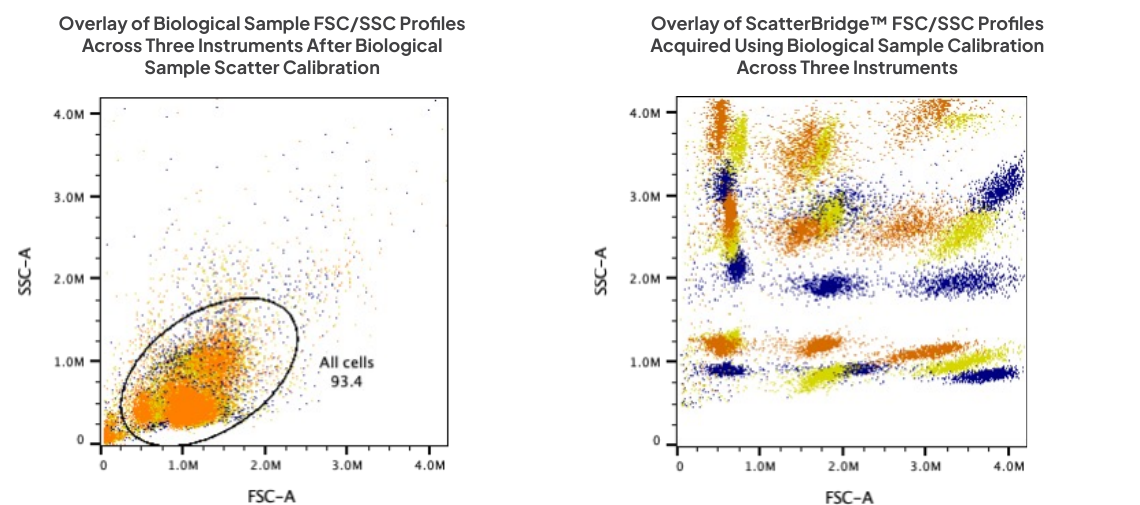
Overlays of the biological sample across all three instruments confirmed strong alignment of key populations, demonstrating successful normalization of detector settings under biologically relevant conditions.
Because gains were optimized for the biological sample, not all nine ScatterBridge populations appeared on the plots. This was expected, as instrument settings were optimized based on display of the biological sample rather than the full dynamic range of ScatterBridge.
The goal of using ScatterBridge in this context is not to capture all nine populations, but to monitor instrument performance. Populations that appear within the scatterplot axes are sufficient to track changes in sensitivity, detect shifts, and ensure consistency across instruments over time. Differences in how populations appear on each instrument are expected, as each cytometer has slightly different detector sensitivity, laser power, and optics. Despite this variance, the visible ScatterBridge populations provide a reliable reference for longitudinal performance monitoring.
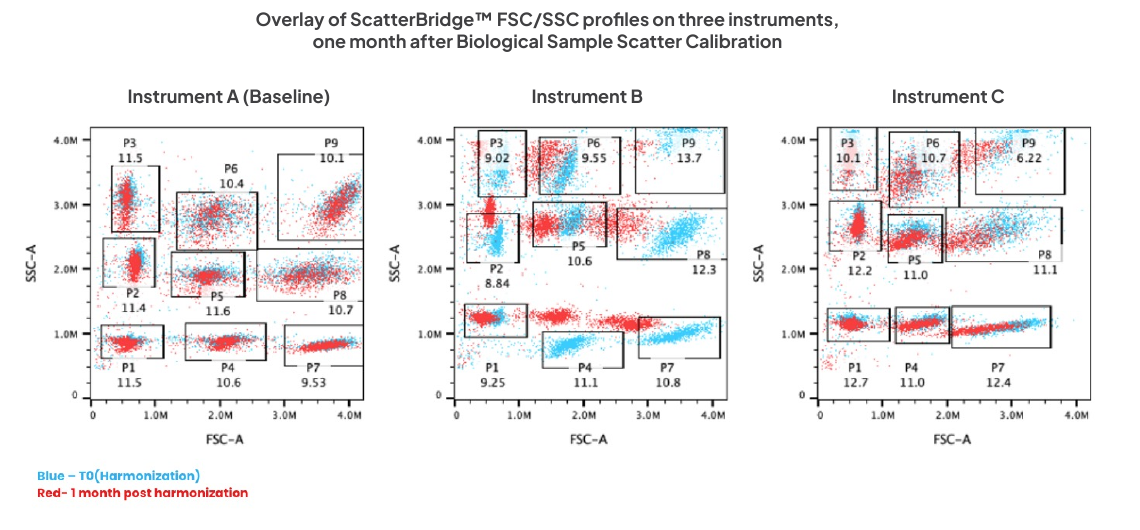
Overlays of ScatterBridge controls acquired from each instrument one month post-calibration demonstrate how instrument performance can be monitored longitudinally using the visible reference populations.
| Populations | Instrument A (Baseline) FSC | Instrument A (Baseline) SSC | Instrument B FSC | Instrument B SSC | Instrument C FSC | Instrument C SSC | %CV Across Instruments FSC | %CV Across Instruments SSC |
|---|---|---|---|---|---|---|---|---|
| P1 | 6.9 | 2.1 | 28.1 | 0.1 | 1.0 | 3.2 | 12.43 | 16.93 |
| P2 | 6.2 | 0.8 | 14.5 | 10.5 | 2.6 | 2.9 | 6.37 | 12.70 |
| P3 | 7.0 | 2.4 | 35.4 | 9.3 | 2.6 | 1.8 | 17.96 | 10.54 |
| P4 | 7.0 | 1.3 | 7.2 | 29.3 | 7.4 | 3.3 | 11.79 | 19.85 |
| P5 | 5.3 | 2.6 | 19.4 | 1.6 | 5.3 | 3.2 | 10.80 | 18.15 |
| P6 | 6.1 | 1.6 | 13.0 | 4.7 | 6.7 | 2.3 | 9.68 | 12.65 |
| P7 | 5.5 | 1.3 | 15.7 | 11.1 | 12.7 | 3.1 | 9.88 | 14.34 |
| P8 | 7.2 | 1.0 | 23.2 | 4.3 | 8.4 | 3.2 | 11.81 | 15.41 |
| P9 | 7.8 | 1.4 | 16.1 | 0.00 | 12.4 | 1.9 | 11.65 | 16.32 |
Table 3: %CV of FSC and SSC Median Values Across Cytometers One Month Post-Harmonization and PM
Instrument performance was tracked one month post-harmonization (Table 3), during which routine preventive maintenance (PM) was also performed on all three instruments. Overall, both the 5-Laser Cytometer-A (reference) and the 3-Laser Cytometer maintained stable performance, with %CV for FSC and SSC remaining low across most populations. For Cytometer-A, FSC %CV ranged from 5.3–7.8% and SSC %CV from 0.8–2.6%, while the 3-Laser cytometer showed FSC %CV of 1.0–12.7% and SSC %CV of 1.8–3.3%, indicating minimal inter-instrument variability.
In contrast, the 5-Laser Cytometer-B exhibited marked variability in several populations following PM. FSC %CV ranged from 7.2–35.4% and SSC %CV from 0–29.3%, with particularly large shifts observed in P1 (FSC 28.1%), P3 (FSC 35.4%), and P4 (SSC 29.3%). These deviations corresponded to measurable shifts in FSC and SSC population positions, highlighting localized changes in instrument response. ScatterBridge™ effectively detected these early, instrument-specific gain drifts.
These observations demonstrate that ScatterBridge™ can sensitively monitor instrument-specific performance changes after maintenance events while showing that the other cytometers remained stable, all without the need for additional biological sample acquisition.
Instrument Lifecycle Management
Scatter Stability During Lab Move
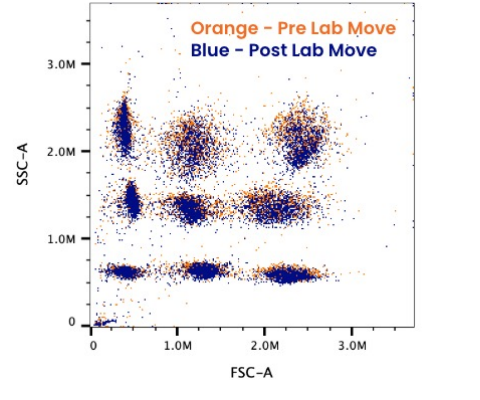
ScatterBridge™ showed consistent scatter profiles before and after instrument relocation, with minimal deviation in population positioning. This confirms that scatter performance remained stable and that any deviations could be readily identified and corrected. This use case highlights its utility in maintaining data continuity during lab transitions.
Monitoring and Optimizing PMI Impact
During PMI, mid-maintenance data revealed temporary shifts in FSC values. Utilizing ScatterBridge™ as part of the instrument lifecycle management workflow allowed the laboratory to:
- Quantify the magnitude of change introduced
- Adjust settings more precisely
- Restore original performance specifications with high fidelity
- Ensure regulatory compliance by documenting that the instrument returned to its validated state post-servicing
Post-PMI results showed strong alignment with pre-PMI baseline, confirming effective recalibration.
Observed variation between pre- and post-PMI:
- FSC variation: −2.2% to +4.5%
- SSC variation: −1.5% to +3.6%
These results indicate high reproducibility, minimal drift and reliable recovery following maintenance.
Advantages Over Existing Controls:
- Audit Readiness: Synthetic controls offer the stability required for long-term studies, where biological drift could invalidate the audit trail.
- Fluorescent beads differ substantially from most biological samples in light scatter properties, while ScatterBridge controls offer a wide range of populations to represent biological samples.
- Unlike biological controls, ScatterBridge helps enable biologically relevant scatter standardization without the biohazardous risk, short shelf life and donor or culture variability.
By integrating ScatterBridge™ into workflows, laboratories can establish consistent scatter, improving reproducibility across studies and systems.
Conclusion
ScatterBridge™ provides a robust and reproducible solution for standardizing and harmonizing forward and side scatter (FSC and SSC) in flow cytometry. By enabling alignment across instruments, including platforms with different laser configurations, it ensures that scatter measurements are consistent and comparable across instruments, sites, and operators.
Key benefits demonstrated in this study include:
- Instrument-to-instrument alignment: Harmonization of FSC and SSC using ScatterBridge allows consistent population positioning across cytometers with varying detector sensitivities and laser configurations.
- Cross-site reproducibility: Biological sample–guided calibration confirms that median scatter values could be compared across instruments, supporting comparable measurements across laboratories.
- Long-term performance monitoring: Visible ScatterBridge populations provided a reliable reference to track instrument sensitivity, detect drift, and confirm stability over time, including one month post-calibration.
- Lifecycle management: ScatterBridge effectively monitored instrument performance during critical events such as preventive maintenance interventions (PMI) and laboratory relocations, to ensure rapid identification and correction of deviations.
- Regulatory compliance and audit readiness: As a non-biological, stable control, ScatterBridge provides reproducible scatter data suitable for documentation and validation in regulated environments.
By filling a critical gap in scatter standardization, ScatterBridge complements existing fluorescence-based controls, establishes reproducible FSC/SSC baselines, and provides a framework for harmonized, audit-ready flow cytometry workflows from installation through routine operation.
References
- Slingshot Biosciences — ScatterBridge™ Product Documentation
- CLSI H62. Validation of Assay Performance for Multivariate Flow Cytometry; Approved Guideline. (Verification of regulatory compliance and standardization protocols).
- BD Biosciences. Introduction to BD Cytometer Setup and Tracking (CS&T) Technology. (Reference for CS&T baseline and performance monitoring).
- Shapiro, H. M. (2003). Practical Flow Cytometry, 4th Edition, Wiley-Liss.
- Kalina, T. (2020). Reproducibility of flow cytometry through standardization: Opportunities and challenges. Cytometry Part A, 97, 137–147.
Featured product
ScatterBridge®
slingshotbio.com/products/scatterbridgeSSB-34-A
 View all product info
For Research Use Only. Not for use in diagnostic or therapeutic procedures.
Stay Updated
Subscribe to receive product updates, new resources, webinars, and application notes.
Get the full application note
Download the complete note as a PDF, with the figures and reference, to share with your team.
Download PDF