- 23 of 30markers for which SpectraComp was interchangeable with cells as the reference control
- ≥0.999similarity index to cells across most fluorophores in the iCore panel
- 513 / 648stain index (APC / FITC), the highest of the compensation beads tested
- 1stoverall ranking on stain index, event rate consistency and price per test
Abstract
This requires reference controls that closely match the autofluorescence and spectral characteristics of cells. In two studies, Slingshot’s SpectraComp® cell-like controls were compared against other commercially available compensation bead products, such as UltraComp eBeads™. Study 1 demonstrated that SpectraComp generated spectral signatures that were more similar to cells in comparison to UltraComp eBeads. Moreover, SpectraComp was interchangeable with cells as reference controls for 23 out of 30 markers when using a core pan-immune monitoring spectral cytometry assay with six open drop-in channels (iCoreDrop) showcasing improved spectral unmixing for markers such as CD45RA, CD14, CD19, and TCRγδ positive cells. Study 2 tested multiple compensation bead products and found SpectraComp controls achieved the highest stain index and overall performance ranking. Together, these studies demonstrated SpectraComp is a robust and practical alternative to cell-based reference controls, offering improved spectral matching, reduced background, and high-quality data across a broad range of applications.
Introduction
Flow cytometry is a technique that allows the measurement of multiple parameters at once by using either specific detectors for each fluorochrome or broader spectra for more detailed analysis.
Conventional flow cytometry measures each fluorochrome with a dedicated detector, while spectral flow cytometry captures the full emission spectra across multiple detectors. Both approaches allow researchers to characterize complex cell populations and detect rare subsets, offering flexibility in experimental design and data analysis.
As the number of fluorochromes in a panel increases, spectral overlap can become a challenge by making it harder to accurately distinguish individual signals. In conventional flow, single-stained controls are used to determine the extent of spectral spillover to facilitate proper compensation. In spectral flow, reference controls with the necessary spectral signatures are used to mathematically resolve overlapping signals. Ideally, reference controls should use the cells of interest to account for cell autofluorescence and background. However, compensation beads can be used as an alternative to using cells as reference controls, due to compensation beads being valuable when cell samples are limited, cell populations are rare, or markers of interest are expressed at low levels.
In this application note, the use of Slingshot Biosciences’ SpectraComp® controls was showcased in two independent studies as a reliable, cell-like reference control that improves spectral unmixing and streamlines compensation workflows in complex multicolor panels compared to other commercially available compensation beads. In addition, SpectraComp controls have a non-plastic composition allowing them to have scatter profiles that are highly similar to cells. By more closely matching cell-based spectral profiles, SpectraComp controls can help bridge the gap between bead-based controls and cell-based spectral profiles, reducing errors associated with spectral overlap, and improving bead-based compensation.¹
Methods
Study 1: Design
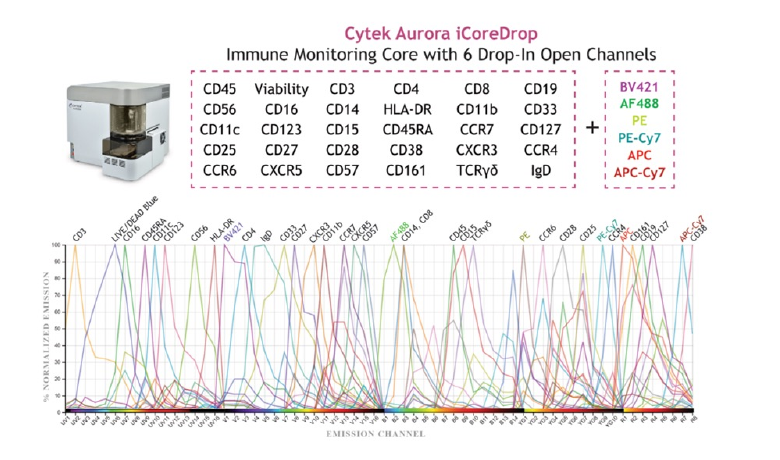
A robust 30-panel spectral immunophenotyping assay with flexible drop-in capability was developed for immune biomarker analysis known as the iCoreDrop. The iCore immune monitoring panel captures diverse immune subsets that includes T cells, B cells, NK cells, monocytes, dendritic cells, and granulocytes from peripheral blood. Additional user-selected biomarkers can be incorporated via designated drop-in channels that can include BV421, Alexa Fluor 488, PE, PE-Cy7, APC, and APC-Cy7 (Figure 1). For study 1, SpectraComp (Slingshot Biosciences) and UltraComp eBeads (Invitrogen) were compared against cells as single-stain reference control in this assay using whole blood samples on the Cytek Aurora cytometer.
Study 1: Materials and Methods
Sample Preparation: Peripheral blood was collected from healthy donors in sodium heparin tubes. The samples were processed within 24 hours by lysing whole blood aliquots with BD Pharm Lyse Buffer (BD Biosciences) for 15 minutes at room temperature. After lysing and washing the cells, the lysed leukocyte pellets were resuspended in 500 μl of staining buffer (BD Biosciences). These samples were ready for immunostaining.
Flow Cytometry Staining: Staining for the iCoreDrop panel was performed as described in Jensen and Kim² including optimizations for selected markers (TCRγδ, CCR7, and CD25) to improve resolution. The full antibody panel is detailed in Table 1 from the protocol provided by Jensen and Kim². In addition, the spectral panel also included a viability dye that was added to the samples prior acquisition.
Reference Controls: Single-stain reference controls were prepared using either cells that were stained with the same procedure as above or beads. These bead-based controls were generated by incubating 1 μl of antibody reagent with 30 μl of UltraComp eBeads or SpectraComp for 2 minutes at room temperature before resuspension in Ca²⁺/Mg²⁺-free PBS.
Instrumentation and Analysis: Samples were acquired on a 5-laser Cytek Aurora using Cytek Assay Settings. Acquired data was analyzed in SpectroFlo v 2.0 software (Cytek Biosciences) to calculate the similarity index (SI) during unmixing.
Study 2: Design
The second study evaluated multiple commercially available compensation beads to assess performance metrics including stain index for medium and bright fluorophores (FITC and APC, respectively), event rate consistency, average event rate per second, and price per test.
Study 2: Materials & Methods
Compensation Beads: Each compensation bead was stained according to the manufacturers protocol, which was adding 1 µg of antibody per 1 mL with the addition of the following resuspended compensation beads tested:
- Invitrogen™ AbC™ Total Antibody Compensation Bead Kit
- BD™ CompBeads Anti-Mouse Ig, κ/Negative Control Compensation Particles Set
- BD™ CompBead Plus Anti-Mouse Ig, κ/Negative Control (BSA) Compensation Plus (7.5 µm) Particles Set
- BioLegend Compensation Beads
- Invitrogen OneComp eBeads™ Compensation Beads
- Slingshot Biosciences SpectraComp®
- Spherotech COMPtrol Kit, Goat anti-Mouse Ig (H&L) Coated Particles, 3 populations (Negative, Low, & High)
- Invitrogen UltraComp eBeads™ Compensation Beads
Flow Cytometry Staining: Each bead was stained with either APC anti-mouse CD4, Rat IgG2b,k (brightness – high) or FITC anti-mouse CD4, Rat IgG2b,k (brightness – medium).
Instrumentation and Analysis: Beads were acquired on the following cytometers to assess event rate stability and fluorescence performance.
- Cytek® Aurora
- BD FACSymphony™ A5 Cell Analyzer
- Thermo Fisher Bigfoot Spectral Cell Sorter
- Beckman Coulter Cytoflex benchtop Cell Sorter
- BD FACSymphony S6 Cell Sorter
- BD FACSDiscover™ S8 Cell Sorter
- Thermo Fisher Attune NxT Analyzer
For the analysis, the acquired data was analyzed in FCS Express 7 (De Novo Software) for population frequency, which helped in determining the stain index. Event rate metrics were collected with the tested instruments and used to rank beads for overall suitability in spectral compensation workflows. Furthermore, average event rate per second, and price per test were considered in the ranking system. These final scores were used to rank beads from 1 to 6, with a 5-point penalty if the bead had an inconsistent event rate. Therefore, lower scores showed a higher ranking.
Results & Discussion
Study 1: iCORE Panel and Reference Selection
Successful spectral unmixing relies on optimal single stain reference controls. SpectraComp demonstrated high spectral concordance with cells across most fluorophores with Similarity Index (SI) values comparable to or exceeding UltraComp eBeads since the SI was greater than or equal to 0.999 representing identical (or stable) spectral profiles (Figure 2).
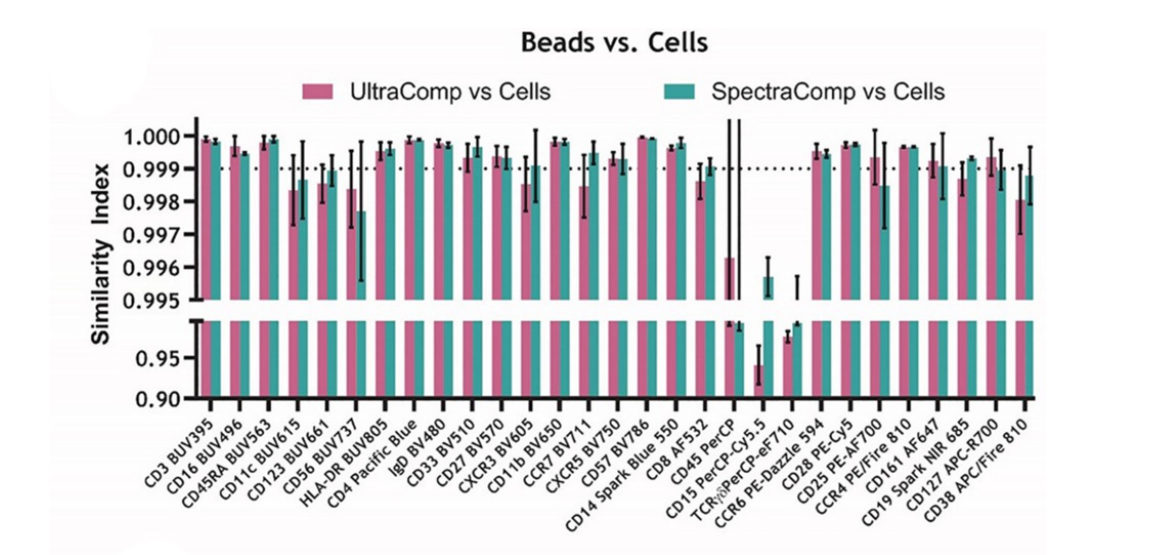
While both bead-based controls showed strong overlap with cells (SI >0.999), notable discrepancies were observed with resulting SI <0.999, which is an indication of deviations between spectral profiles. These discrepancies were observed for several fluorophores, including CD11c BUV615, CXCR3 BV605, CD56 BUV737, CD8 AF532, CD25 AF-PE700, and CD38 APC/Fire 810. The discrepancies were much more impactful on CD45 PerCP, CD15 PerCP-Cy5.5, and TCRγδ PerCP-eF710. In the case of CD123 BUV661, the discrepancy was due to the antibody being unstable.²
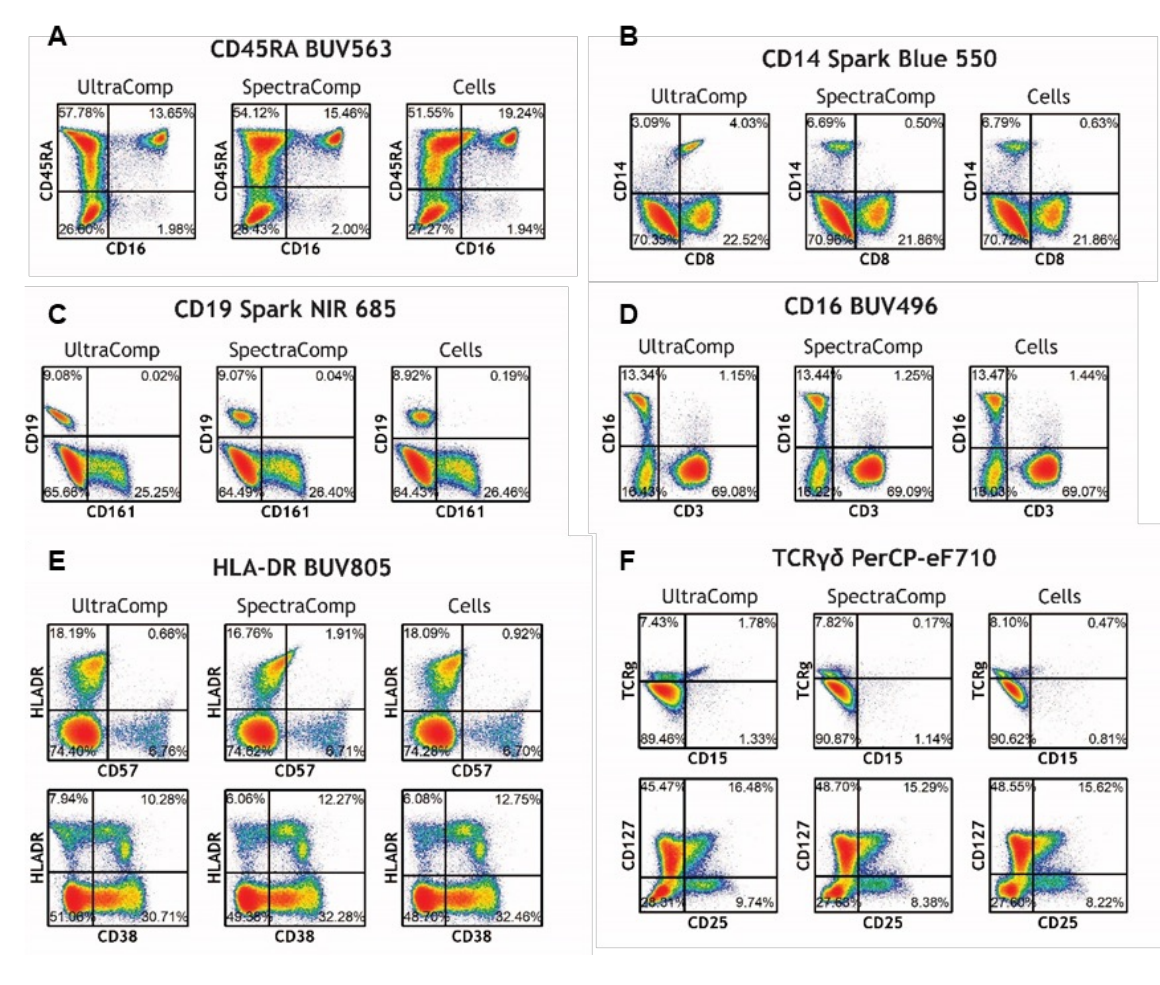
N × N plots of fully stained samples of total lymphocytes and monocytes were examined after replacing each single stain with either UltraComp, SpectraComp, or cell-based reference control to understand how different reference control formats impact unmixing (Figure 3).
SpectraComp beads stained with CD45RA BUV563, CD14 Spark Blue 550, and CD19 NIR 685 improved all neighboring or correlated markers (Figure 3A, 3B and 3C). Furthermore, SpectraComp beads stained with CD16 BUV496 improved CD3 BUV395 with barely any reduction in CD33 BV510 resolution (Figure 3D). HLA-DR BUV805 SpectraComp beads better recapitulated CD38 APC/Fire 810 staining on cells with minor skewing of CD57 BV785 (Figure 3E). Additionally, TCRγδ PerCP-eF710 had poor similarity on both bead formats, but SpectraComp were able to resolve TCRγδ better while eliminating false positive signals for PerCP-Cy5.5 on TCRγδ cells without impacting CD127 APC-R700 (Figure 3F). Lastly, SpectraComp improved spectral unmixing for markers like CD45RA, CD14, CD19, and TCRγδ, by helping with background reduction and spectral matching.
Taking everything into account, SpectraComp produced spectral profiles closer to cells than traditional compensation beads. SpectraComp controls were interchangeable with cells as the optimal reference control format for 23 of 30 markers in the panel (Table 1).
| Marker | Fluorophore | Reference Control | Comparison of cells and compensation beads for iCore reference controls |
|---|---|---|---|
| CD3 | BUV395 | SpectraComp | Interchangeable. |
| Viability | Live/Dead BLUE | Cells | - |
| CD16 | BUV496 | SpectraComp | Interchangeable. UltraComp eBeads improve BUV510. SpectraComp beads improve BUV395. |
| CD45RA | BUV563 | SpectraComp | SpectraComp beads improve Live/Dead, BUV496, BV570, AF532 and PE-Dazzle 594 compared to UltraComp eBeads. SpectraComp beads reduce background in BUV496 compared to cells. |
| CD11c | BUV615 | SpectraComp | Interchangeable. |
| CD123 | BUV661 | Cells | Cells improve AF647 and Spark NIR 685 compared to either bead format. |
| CD56 | BUV737 | UltraComp | UltraComp eBeads improve BV750 and BV785 compared to SpectraComp beads or cells. |
| HLA-DR | BUV805 | SpectraComp | SpectraComp beads improve APC/Fire 810 compared to UltraComp eBeads. SpectraComp beads can skew BV785. |
| CD4 | Pacific Blue | SpectraComp | Interchangeable. |
| IgD | BV480 | SpectraComp | Interchangeable. |
| CD33 | BV510 | SpectraComp | Interchangeable. Cells slightly reduce resolution of all markers. |
| CD27 | BV570 | SpectraComp | Interchangeable. |
| CXCR3 | BV605 | SpectraComp | Interchangeable. |
| CD11b | BV650 | UltraComp | UltraComp eBeads improve BUV661, PE-Cy5, AF647 and Spark NIR 685 compared to SpectraComp beads or cells. |
| CCR7 | BV711 | SpectraComp | Interchangeable. |
| CXCR5 | BV750 | SpectraComp | Interchangeable. |
| CD57 | BV786 | UltraComp | UltraComp eBeads improve BV510 and APC/Fire 810 compared to SpectraComp beads or cells. SpectraComp beads can skew BUV805. |
| CD14 | Spark Blue 550 | SpectraComp | SpectraComp beads improve AF532 compared to UltraComp eBeads. Cells increase BUV469 background compared to SpectraComp beads. |
| CD8 | AF532 | SpectraComp | Interchangeable. |
| CD45 | PerCP | SpectraComp | SpectraComp beads improve BUV661 compared to UltraComp eBeads or cells. |
| CD15 | PerCP-Cy5.5 | Cells | Cells improve AF647, Spark NIR 685 and APC-R700 compared to either bead format. |
| TCRγδ | PerCP-eF710 | SpectraComp | SpectraComp beads improve PerCP-eF710 compared to UltraComp eBeads or cells. SpectraComp beads recapitulate cell-based CD4 PerCP-eF710 more so than TCRγδ on cells. |
| CCR6 | PE-Dazzle 594 | SpectraComp | Interchangeable. |
| CD28 | PE-Cy5 | SpectraComp | Interchangeable. |
| CD25 | PE-AF700 | SpectraComp | Interchangeable. |
| CCR4 | PE/Fire 810 | SpectraComp | Interchangeable. |
| CD161 | AF647 | SpectraComp | Interchangeable. |
| CD19 | Spark NIR 685 | SpectraComp | SpectraComp beads improve AF647 and APC-R700 compared to UltraComp eBeads. |
| CD127 | APC-R700 | SpectraComp | Interchangeable. |
| CD38 | APC/Fire 810 | UltraComp | UltraComp eBeads improve BV785 compared to SpectraComp beads or cells. |
Table 1: Reference control optimization - Performance comparison of UltraComp eBeads, SpectraComp, or cells used as single stain controls.
Interestingly, SI was not always predictive of spectral unmixing performance. Fluorophores with high bead versus cell SI and little discernible differences, such as CD45RA BUV563 and Spark Blue 550, had improved unmixing results when using SpectraComp. Some fluorophores, like CD11c BUV615, had lower SI values with SpectraComp but were functionally interchangeable with cells during unmixing. Although cells remained the best control for a few unstable markers, such as CD123 BUV661 and CD15 PerCP-Cy5.5, SpectraComp offered an effective and practical alternative to cells for many targets by outperforming other controls in staining performance.
Study 2: Evaluating Compensation Bead Performance
In this study, Slingshot’s SpectraComp beads demonstrated good resolution between positive and negative populations (Figure 4A). Also, SpectraComp showed the highest stain index among compensation beads tested for both APC anti-mouse CD4 and FITC anti-mouse CD4 (Figure 4B).
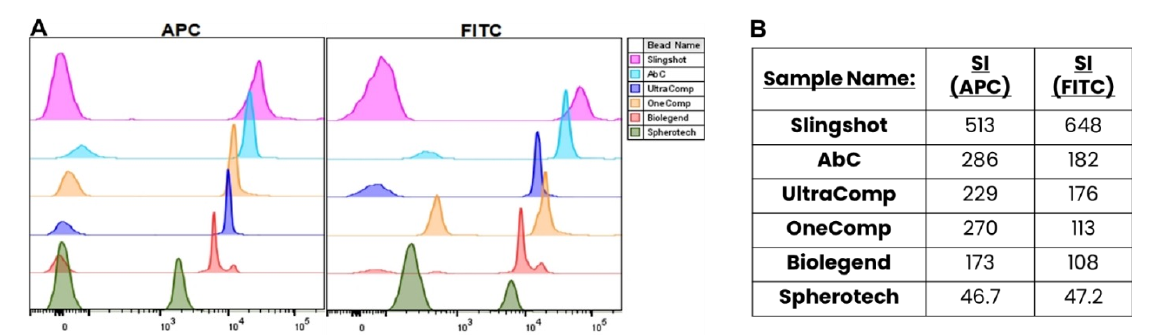
As previously mentioned, the scoring system used to rank bead performance takes into consideration the stain index, event rate consistency, average event rate per second, and price per test.
Due to the very narrow range of target specificity available with BDComp and BDComp+ beads, they were omitted from overall evaluation. In addition, inconsistent event rates were observed throughout the tested instrument when using Biolegend Compensation Beads, UltraComp Beads, and UltraComp+ beads leading to the omission of these beads from the overall rankings.
SpectraComp exhibited the most consistent event rates and the best stain index among the beads tested, achieving the top overall ranking based on all evaluation criteria (Table 2).
| Sample | Stain Index Rating (APC) | Stain Index Rating (FITC) | Was the event rate consistent? | Event rate (Average per sec) | Price Rating | Final Scores | Overall Rating |
|---|---|---|---|---|---|---|---|
| SpectraComp | 1 | 1 | Yes | 3 | 4 | 9 | 1st |
| OneComp | 3 | 4 | Yes | 5 | 2 | 14 | 2nd |
| AbC | 2 | 2 | Yes | 9 | 7 | 20 | 3rd |
| Spherotech | 7 | 7 | Yes | 7 | 8 | 29 | 4th |
| BDComp | X | X | Yes | 6 | 5 | X | X |
| BDComp+ | X | X | Yes | 1 | 9 | X | X |
| Biolegend | 6 | 5 | No | 8 | 1 | X | X |
| UltraComp | 5 | 3 | No | 4 | 3 | X | X |
| UltraComp+ | 4 | 6 | No | 2 | 6 | X | X |
Table 2: Performance scores for compensation beads.
Overall, Study 2 highlights that Slingshot’s SpectraComp beads are a highly effective alternative to cells for many applications.
Conclusion
Accurate selection of single-stain reference controls is critical for minimizing compensation and spectral unmixing errors, ensuring reliable and high-quality data in spectral flow cytometry.
In Study 1, SpectraComp produced spectral profiles that were more closely similar to cells than UltraComp eBeads serving as an interchangeable reference format for 23 of 30 markers. SpectraComp also improved unmixing for markers such as CD45RA, CD14, CD19, and TCRγδ by reducing background signals and improving spectral matching. While primary cells remained the optimal control for a few unstable markers (e.g., CD123 BUV661, CD15 PerCP-Cy5.5), SpectraComp provided a practical alternative for most targets and offered clear advantages when working with rare populations where cell numbers are limited. Study 2 compared the performance of multiple commercial compensation bead products. In this experiment, SpectraComp achieved the highest stain index, with improved resolution between positive and negative populations. Furthermore, SpectraComp consistently outperformed other beads across event rate consistency, average event rate per second, and price per test, resulting in the beads ranking as the top-performing control overall.
Together, these findings establish SpectraComp® as a robust and practical alternative to cell-based controls for compensation and spectral unmixing. With its low autofluorescence and cell-like spectral signature, SpectraComp contributes to more accurate compensation and unmixing resulting in higher-quality data compared to conventional compensation beads.
References
- Slingshot Biosciences. Application Note: A Workflow for Spectral Compensation with SpectraComp® Synthetic Cell Controls. Accessed April 29, 2025. https://slingshotbio.com/wp-content/uploads/2024/12/A-Workflow-for-Spectral-Compensation-with-SpectraComp-Synthetic-Cell-Controls.pdf
- Jensen HA, Kim J. iCoreDrop: A robust immune monitoring spectral cytometry assay with six open channels for biomarker flexibility. Cytometry A. 2023;103(5):405-418. doi:10.1002/cyto.a.24708
- Grenfell R, Bar C, Armstrong C. Freaky Flow: The Disappearance of Compensation Beads. Poster presented at: CYTO 2025, May 31st to June 4th, 2025, Denver CO.
Featured product
SpectraComp®
slingshotbio.com/products/spectracompSSB-05-C
 View all product info
For Research Use Only. Not for use in diagnostic or therapeutic procedures.
Stay Updated
Subscribe to receive product updates, new resources, webinars, and application notes.
Get the full application note
Download the complete note as a PDF, with the figures and reference, to share with your team.
Download PDF